Reporting & dashboards
Turn plant evidence into reporting your business already understands.
Amberhold holds the evidence. You choose how to report it — CSV export, REST API, or the reporting tools your business already runs. Everything on this page is built from the same versioned readings projection your own tools would read.
- evidence rows
- 1,201
- completed rounds
- 186
- abnormal readings
- 27
- re-checked readings — originals preserved
- 8
- recorded top-ups
- 11
- consumables tracked
- 3
One report. Three questions answered.
Click through the three pages below. These are stills from a real report, built in Power BI. In the tool itself every visual answers back: hover a point for the reading beneath it, click a bar and the rest of the page filters around it, open a month out into its days.
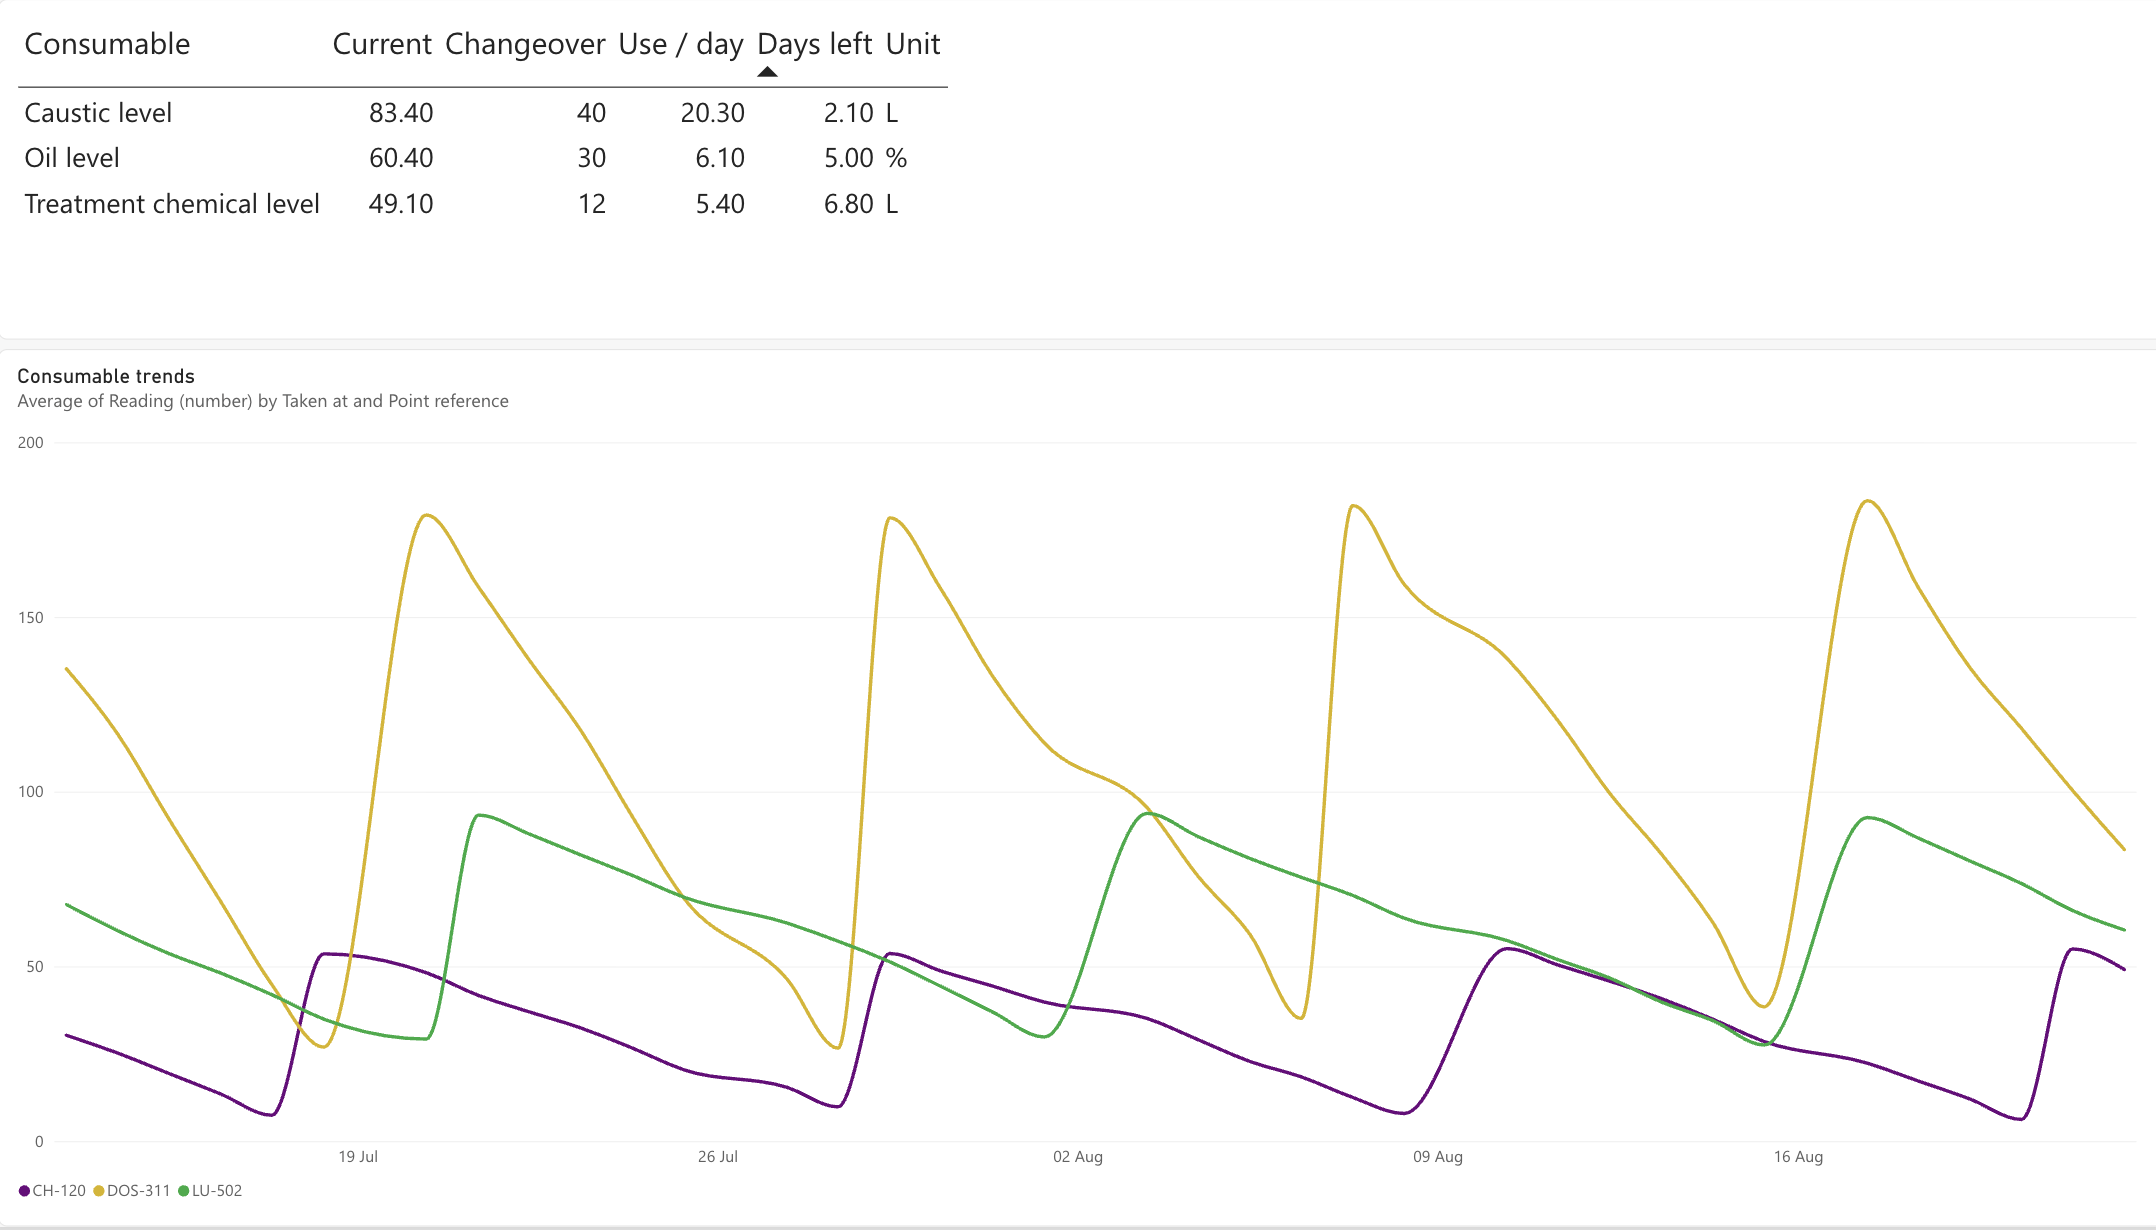
How much is left, how fast it is going, and the days until changeover — worked out from the recorded levels. The six-week trend shows each vessel drawn down and topped back up.
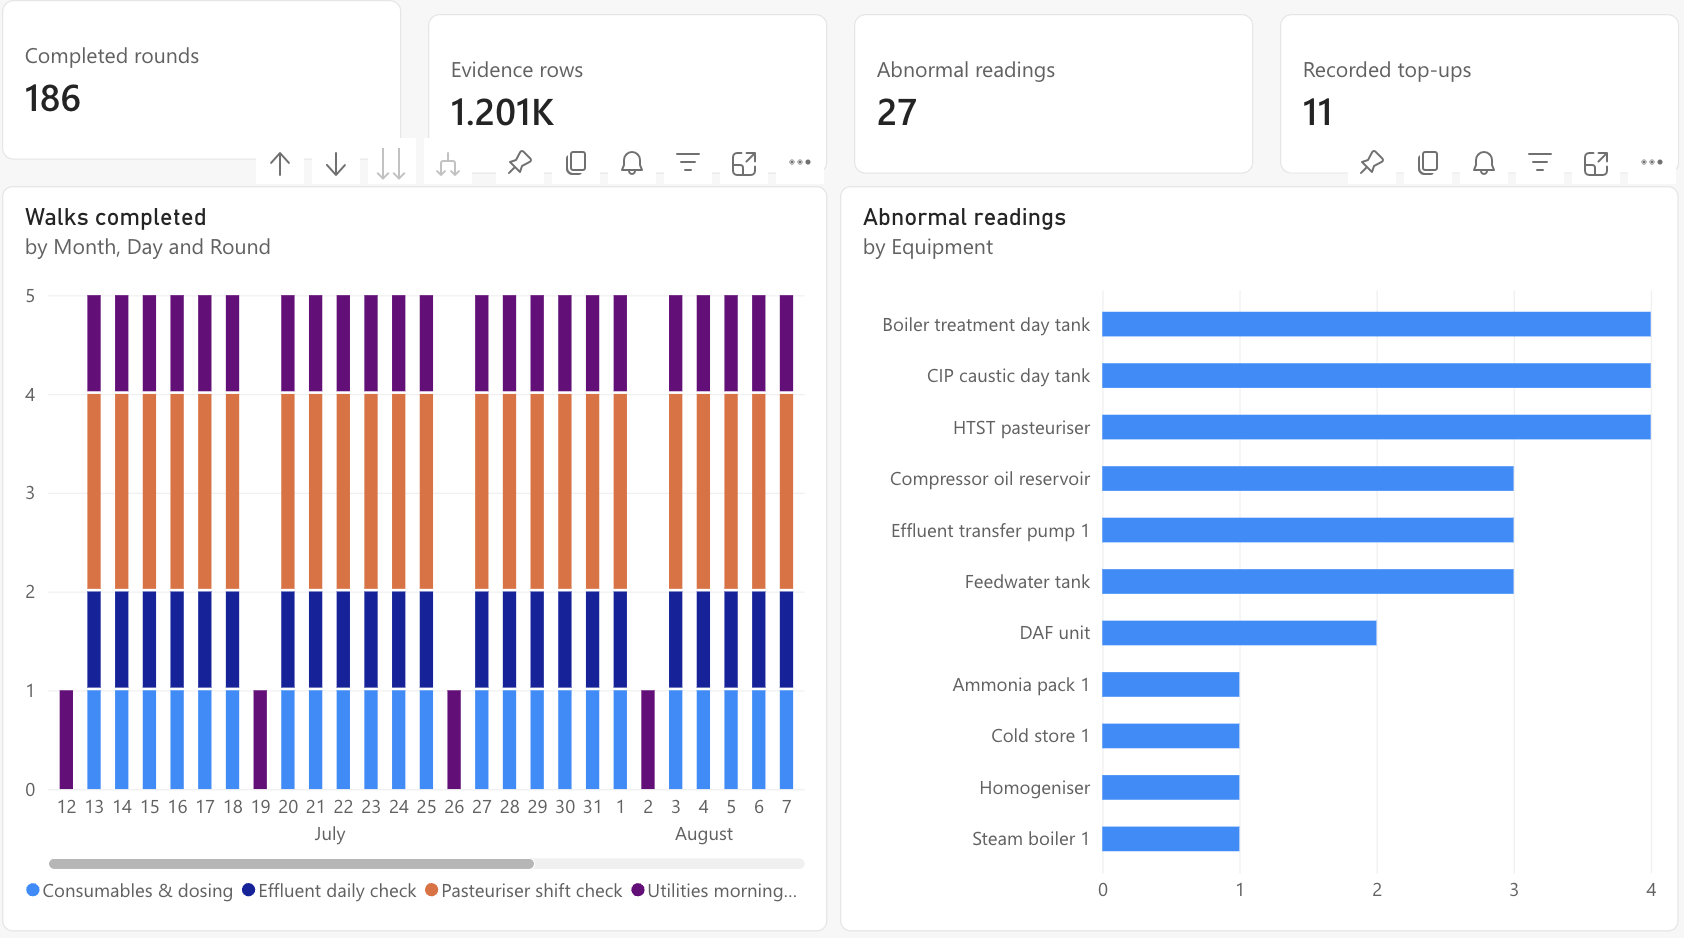
Completed rounds, evidence rows, abnormal readings and recorded top-ups across the top; walks per day and which equipment is flagging most below. The ten-second health check.
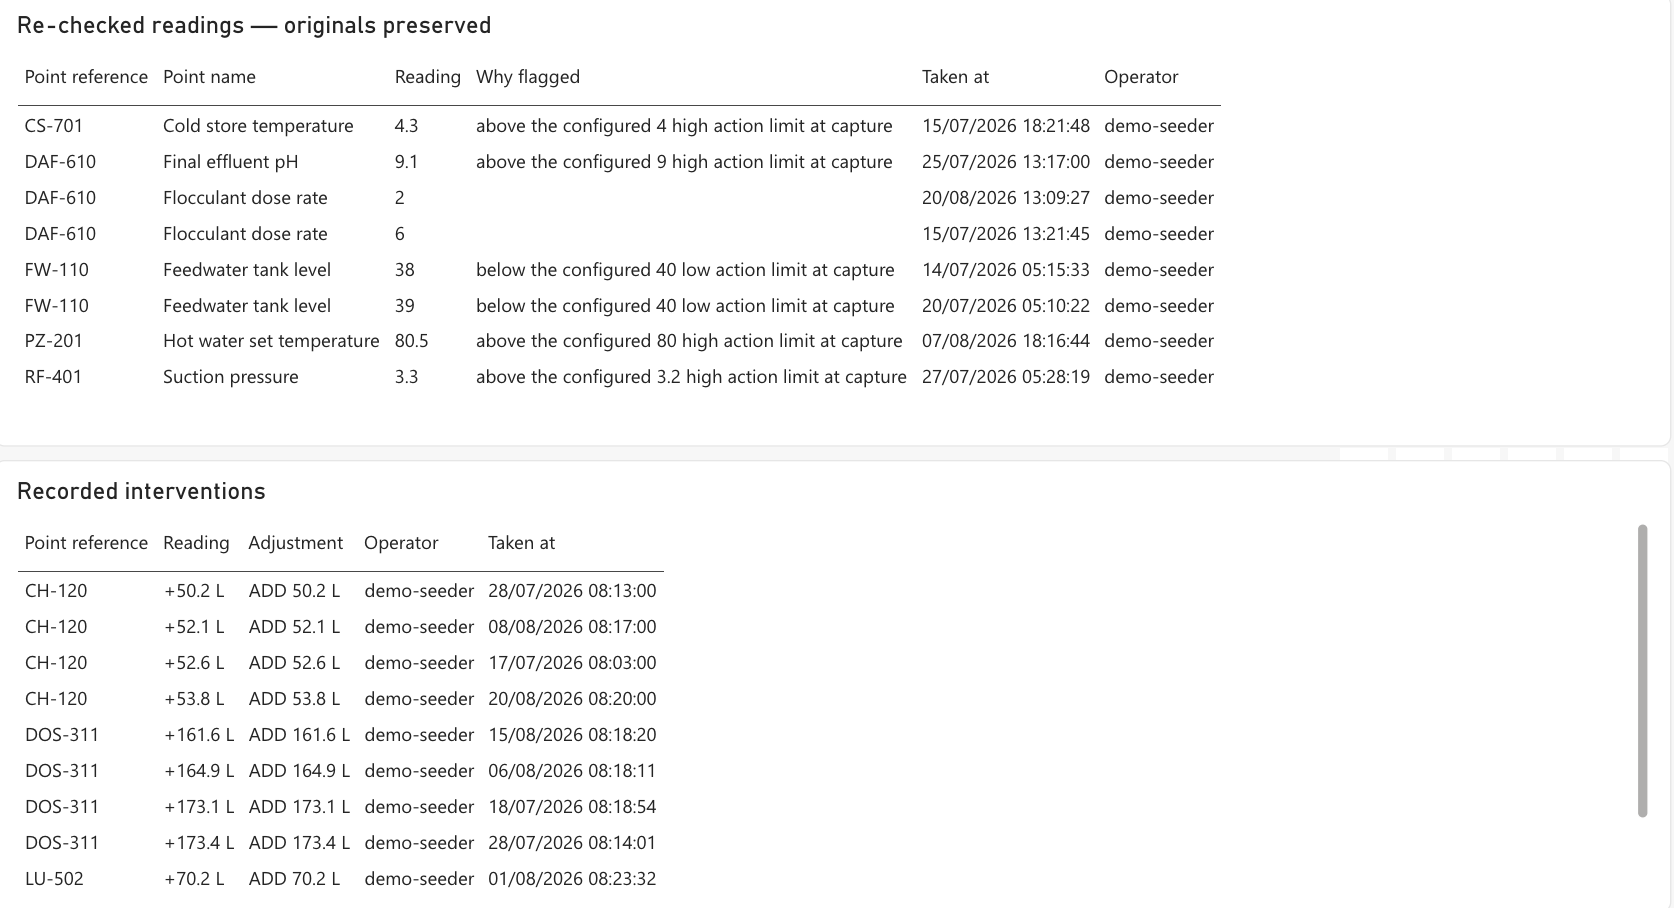
Readings that were later re-checked stay in the record — preserved, never overwritten, with who recorded them and when. Where a limit was crossed at capture, the row says which. Below, every top-up as its own recorded intervention.
Demonstration site. Built from the readings projection, not a mock-up.
Your data, your tools
One projection, however you read it — columns are only ever added, never renamed or retyped. Whatever reads it today keeps reading it.
- CSV exportgoverned, audited, one click — the same projection this page shows
- REST APIversioned readings projection; connected unattended with a revocable machine identity
- Power BIpublished Power Query source against the same API
- Microsoft Fabricsame source, documented for Fabric dataflows
- Excel (Windows)same query, documented; Excel for Mac cannot refresh it — we say so rather than let you discover it
- Your own reporting toolsanything that reads CSV or REST reads Amberhold